How to Write a Charity Impact Report (Worked Example)
A charity impact report shows what changed for beneficiaries, not just which activities took place, and funders typically read it before the accounts. It differs from a statutory annual report or Trustees' Annual Report, though it can draw on the same data. A seven-section structure covering context, theory of change, headline numbers, evidence, stories and learning is what most funders expect, and most small charities can produce a credible report in two to four pages.
What an impact report is (and what funders want from it)
A question I keep hearing from small charities — and answer for my own, since I write its funding applications — is what a funder actually wants from a charity impact report. Short answer: a credible line from what you did to what changed. A charity impact report is a document, separate from your statutory accounts, that explains what difference your work made to the people or causes you exist to help, using a mix of numbers, evidence and short narrative examples; funders want to see the link between outputs (what you did) and outcomes (what changed as a result), not just a list of activities delivered. The longer answer — the seven-section structure below, part of our impact measurement handbook — decides whether your next renewal starts warm or cold.
Most trusts and foundations use some version of an impact report, alongside your accounts, to decide whether to renew or increase funding, so treat it as a sales document built on honest evidence rather than a compliance afterthought. The 360Giving GrantNav dataset of past awards shows how much detail funders record about what they funded and why, which is a useful proxy for what they expect to see reported back.
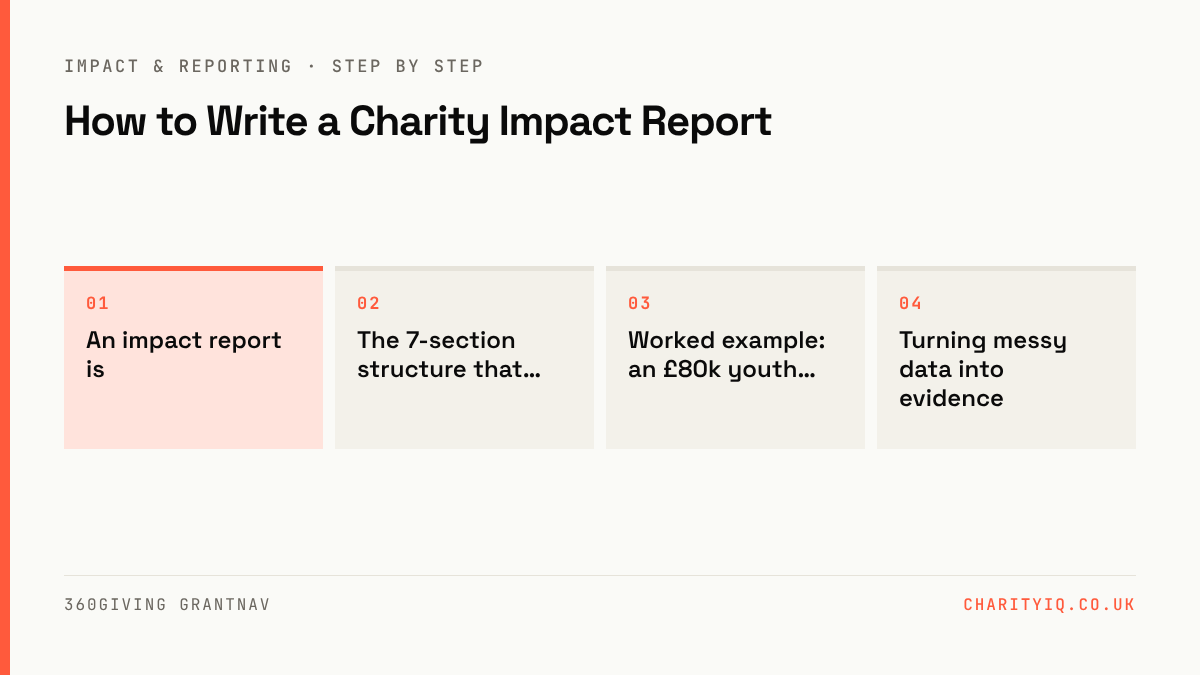
The 7-section structure that works
A funder-ready impact report needs seven sections: context and need, your theory of change in one paragraph, headline numbers, evidence for your key claims, real (anonymised) stories, honest learning, and what’s next. Skipping the “learning” section is the single biggest mistake: funders trust reports more, not less, when charities admit what didn’t work.
- Context and need: one paragraph on the problem you exist to address and why it still matters this year.
- Theory of change, summarised: a short version of your theory of change template, showing the logic from activity to outcome.
- Headline numbers: 3–5 top-line stats, each clearly labelled as an output (what you did) or an outcome (what changed).
- Evidence for your claims: the data behind the headline numbers, e.g. survey results, case-recording data, or externally verified figures.
- Stories: one or two anonymised, specific examples that illustrate the numbers, not replace them.
- Learning: what surprised you, what you’d do differently, and what you’re still not sure about.
- Next year: what you plan to measure or change, so the report reads as a conversation, not a one-off.
Worked example: an £80k youth charity
Take a fictional charity, Riverside Youth Project, with an annual income of roughly £80,000, running after-school mentoring for 45 young people. Its impact report doesn’t need to be long or slick; it needs to show a credible line from money spent to change achieved.
Context: “Local school data shows persistent absence has risen among 11–16 year olds in our ward over the past two years. Riverside exists to keep at-risk young people engaged in education through one-to-one mentoring.”
Headline numbers: 45 young people mentored (output); 34 of 40 tracked young people (85%) improved school attendance during the programme, measured against school-reported attendance data (outcome); 28 of 32 surveyed young people (88%) reported feeling “more confident about the future” on exit surveys (outcome).
Evidence: attendance data supplied by partner schools, before/after comparison; anonymised exit survey results from 32 of 45 participants (71% response rate, noted honestly rather than hidden).
Learning: “Attendance improved most for young people who attended 10+ mentoring sessions; those who attended fewer than 5 showed little measurable change. Next year we’re testing a minimum-session commitment at referral stage.”
Notice what makes this credible: the response rate is disclosed rather than hidden, output and outcome are labelled separately, and the learning section admits a limitation rather than claiming universal success. That combination is what turns a report into evidence a funder can rely on, not just marketing copy. It’s the pattern I lean on when writing grant applications for my own charity: labelled numbers, disclosed response rates, one honest limitation. Our annotated example impact report shows the full structure filled in end to end.
Turning messy data into evidence
Most small charities don’t lack data, they lack a system for turning scattered spreadsheets, sign-in sheets and case notes into comparable numbers. 80% of UK charities have an annual income under £100,000, according to the NCVO Almanac 2024 (2021/22 data). At that size nobody has a data team; the person writing the report usually also ran the sessions. At my own charity, report season starts with an inventory of what we’ve already got, not a scramble to collect something new. Start by listing every place data already exists (attendance registers, feedback forms, referral records) before deciding what new data you need to collect.
- Standardise your units: decide once whether you’re counting sessions, people, or households, and use that consistently across the report.
- Separate outputs from outcomes explicitly, even in a simple table, so funders can see you understand the difference.
- Report your response rate for any survey data, so 88% positive out of 10 respondents isn’t presented the same as 88% out of 200.
- Use your theory of change to decide what to measure before you go looking for data to fit a story — the outcome indicator picker helps you choose measurable indicators.
From experience: Impact evidence is a timing problem more than a volume problem. At my own charity the rule is to write numbers down in the week they happen — attendance, feedback, anything countable — because reconstructing a year from old emails is how honest organisations end up with vague reports. Funders don’t expect polish from a small charity; what earns trust is a labelled number with its source and response rate attached.
CharityIQ’s impact frameworks compared post walks through frameworks like Outcomes Star, HACT and bespoke logic models if you’re building a measurement approach from scratch.
Impact report vs annual report vs TAR
An impact report is a voluntary, funder-facing document focused on outcomes and evidence; the Trustees’ Annual Report (TAR) is a statutory document filed alongside your accounts that must include a public benefit statement and financial review under SORP; an “annual report” in general usage often just means whichever of these a charity chooses to publish. They can share content, but they answer different questions.
| Impact report | Trustees’ Annual Report (TAR) | |
|---|---|---|
| Required by law? | No | Yes, filed with accounts |
| Main audience | Funders, donors, public | Charity Commission, regulators |
| Focus | Outcomes and evidence | Compliance, finances, public benefit |
| Format | Flexible, often design-led | Structured per SORP requirements |
I file our statutory paperwork myself, so I keep the two jobs separate: the TAR answers the regulator, the impact report answers the funder. For the statutory side, our Trustees’ Annual Report template gives you the SORP-shaped skeleton, and the guide to the SORP impact narrative covers what the TAR must legally include, so you don’t duplicate effort between the two documents.
Design and length: what’s enough
Most small and medium charities can produce a credible impact report in 2–4 pages; length signals effort far less than clarity, honest labelling of outputs vs outcomes, and at least one piece of real evidence per claim. A beautifully designed 20-page report with vague claims is less persuasive to an experienced funder than a plain 3-page report with clearly sourced numbers.
If you have design resources, use them for readability (charts, pull quotes, clear headers), not to pad length. If you don’t, a well-structured Word or Google Docs report with the seven sections above will do the job for most trust and foundation funders.
Free structure template
Use this structure directly as your report outline, whether you download the full formatted version or copy it into your own document:
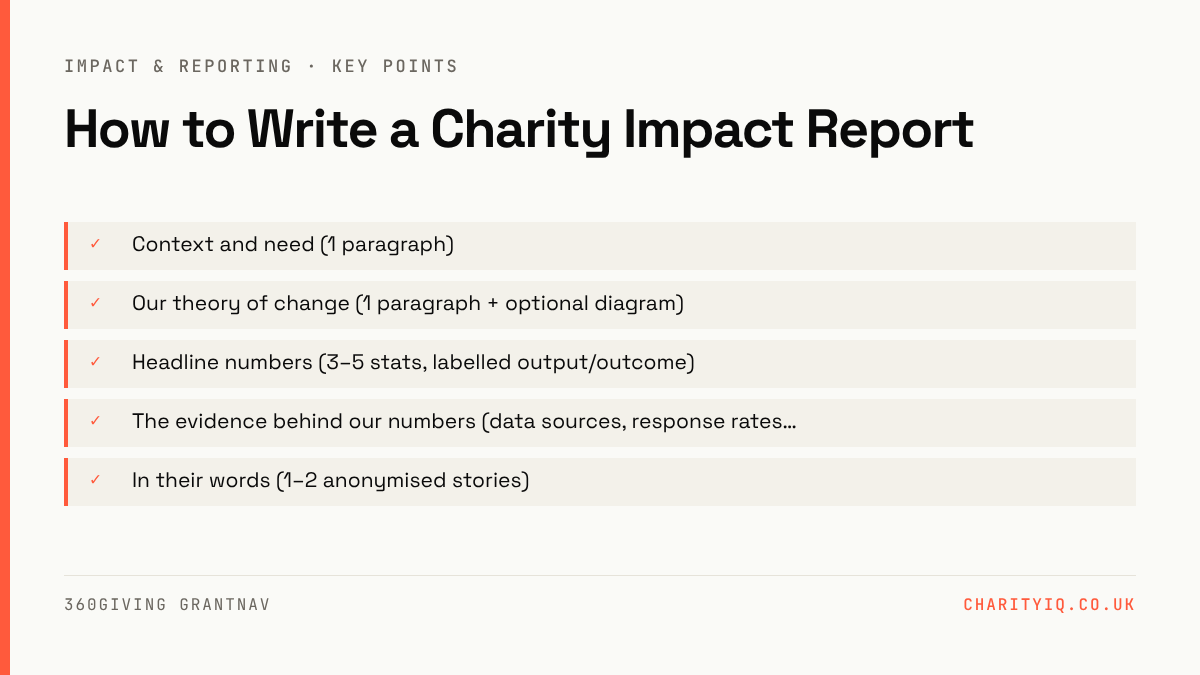
- Context and need (1 paragraph)
- Our theory of change (1 paragraph + optional diagram)
- Headline numbers (3–5 stats, labelled output/outcome)
- The evidence behind our numbers (data sources, response rates, methodology)
- In their words (1–2 anonymised stories)
- What we learned (including what didn’t work)
- What’s next (plans for the coming year)
Trustees approving the final version should check every headline number is traceable back to a data source in section 4, not just asserted in section 3.
What to do next
Pick your most recent full year of data, map it against the seven sections above, and draft your headline numbers first since everything else in the report supports them. Don’t wait for perfect data: an honest report with disclosed limitations beats no report at all.
- Download the free template and fill in section 1 (context) today.
- List every existing data source you have before collecting anything new.
- Draft 3–5 headline numbers, labelled output or outcome.
- Get one trustee to sanity-check every number against its source before publishing.
Want CharityIQ to help turn your data into a funder-ready impact report automatically? Join the impact module waitlist (Template) →
Frequently asked questions
Context, a summarised theory of change, headline output and outcome numbers, the evidence behind those numbers, anonymised stories, honest learning, and plans for next year. The strongest reports clearly separate what you did from what changed as a result.
Most small and medium charities need only 2-4 pages to cover the seven sections credibly. Clarity and evidence quality matter far more to funders than length or design polish, so resist the urge to pad the document out.
An impact report is a voluntary document focused on outcomes for funders and donors; an 'annual report' often refers to the statutory Trustees' Annual Report (TAR), which is filed with your accounts and must cover public benefit and finances under SORP requirements.
Annually is standard for most funder relationships, timed to align with your financial year-end or a specific grant's reporting deadline. Some charities also produce shorter interim updates for major funders partway through a multi-year grant.
Not legally, but most trusts and foundations now expect one as part of renewal or reporting, even from very small grantees. A short, honest report is far more useful to future fundraising than no report at all.
Yes, and you should. Your headline numbers, theory of change summary and stories are exactly the evidence most funders ask for in application forms, so a good impact report becomes a reusable source document for future bids.